
Data analysis · Air quality · Pakistan
Six Pakistani cities, one year of air
Faisalabad, not Lahore, ranked worst. Peshawar was the quiet third.
By Muzammal Hussain · 18 October 2026 · 6 min read
Lahore dominates every conversation about smog in Pakistan. In my earlier analysis, Lahore did not have a single day within the WHO guideline in a whole year. That raised a fair question: is Lahore unusual, or is this the normal state of Pakistan's cities? I applied the same method, the same rules and the same twelve months to six cities.
Key findings
- No city met the WHO 24-hour guideline, which allows only 3-4 days above 15 µg/m³ a year. Even Quetta, the cleanest, was above it on 307 of 364 days.
- Faisalabad ranked worse than Lahore: a yearly mean of 119.6 µg/m³ (24 times the WHO annual guideline), no clean day, and the worst day in the study, 407 µg/m³ on 14 January 2026.
- Peshawar ranked third (91.5 µg/m³), ahead of Islamabad and Karachi, despite getting little public attention.
- Winter is what separates the cities. In summer all six looked similar; in winter Faisalabad's monthly median was more than five times Quetta's.
Data and method
- Source: OpenAQ, an open air-quality data platform. Daily PM2.5 for every fixed sensor within 25 km of each city centre, 18 October 2025 to 18 October 2026.
- Same rules for every city: remove impossible values and days with poor hourly coverage, then take the median across a city's sensors for each day.
- Fair comparison: a city was included only with at least 3 sensors and 300 days of data. All six passed.
- Reproducibility check: Lahore's numbers matched my earlier separate analysis exactly.
The ranking
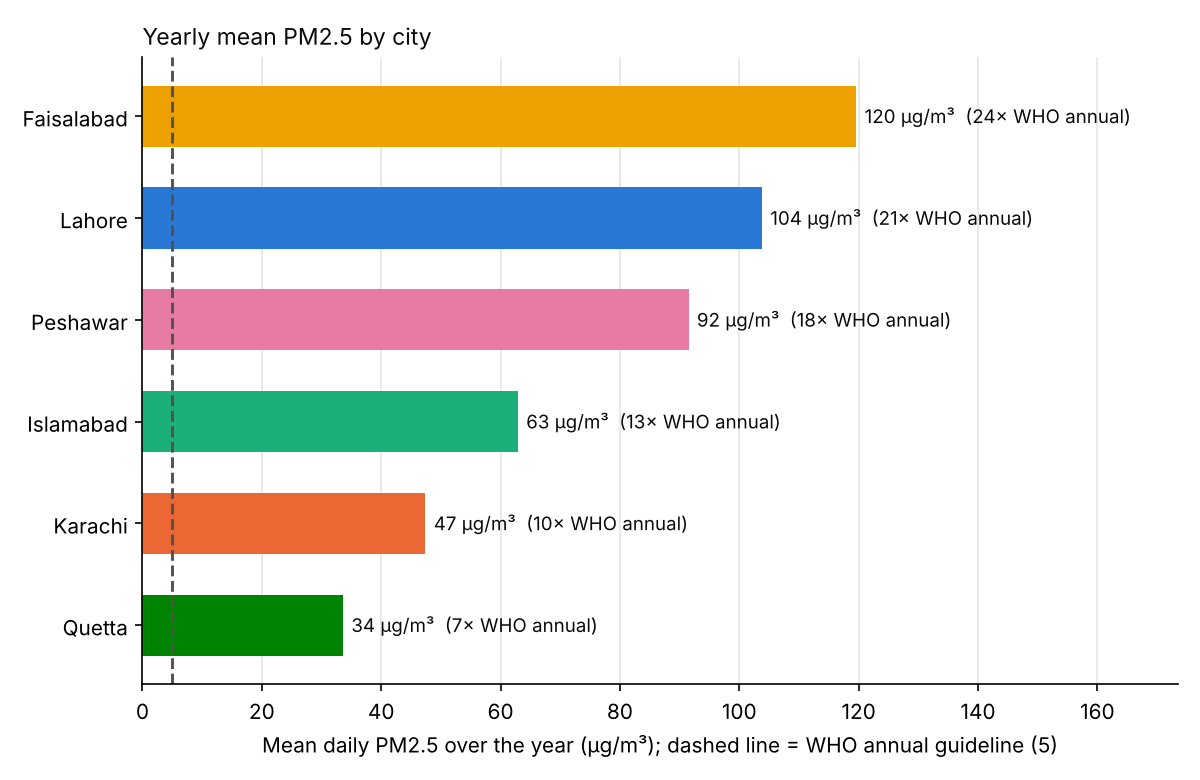
| City | Yearly mean | × WHO annual | Clean days | Days > 75 |
|---|---|---|---|---|
| Faisalabad | 119.6 | 24 × | 0 | 48% |
| Lahore | 103.8 | 21 × | 0 | 46% |
| Peshawar | 91.5 | 18 × | 1 | 40% |
| Islamabad | 62.9 | 13 × | 4 | 27% |
| Karachi | 47.4 | 9.5 × | 4 | 20% |
| Quetta | 33.6 | 7 × | 57 | 6% |
"Clean days" are days at or below the WHO 24-hour guideline of 15 µg/m³; values are in µg/m³. Faisalabad and Lahore did not have one. Quetta had 57, still far short of a healthy year.
The ranking is the same whether the cities are ordered by yearly mean or by the median day (Faisalabad 71, Lahore 67, Peshawar 58, Islamabad 41, Karachi 33, Quetta 27 µg/m³), so it is not driven by a few extreme days. The gap between Faisalabad and Lahore is smaller than the gap to the other cities, and sensor differences could narrow it.
Winter tells the story
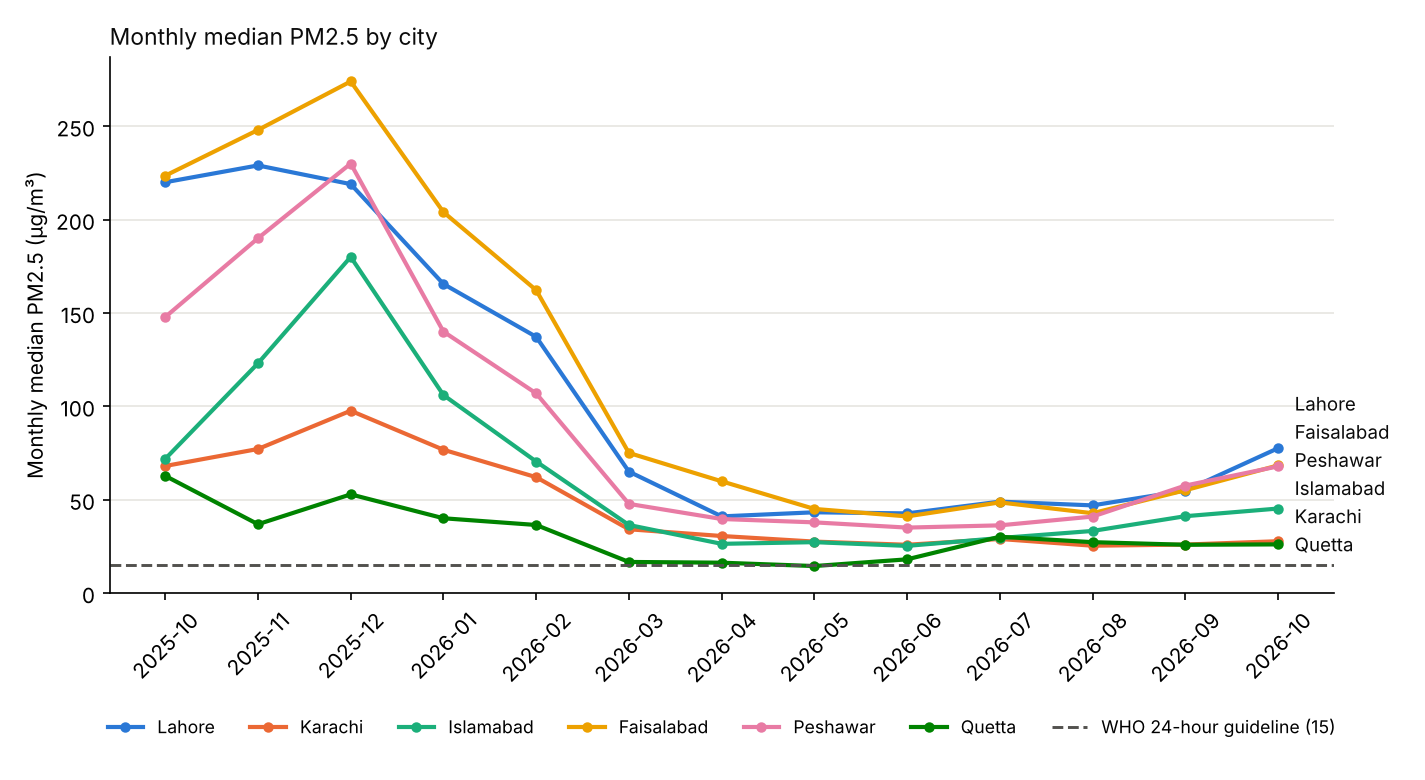
From May to August the six cities sat close together, with monthly medians between about 22 and 45 µg/m³. From November to January they pulled apart: from 43 µg/m³ in Quetta to 242 µg/m³ in Faisalabad. Winter air was about five times worse than summer air in Faisalabad, Peshawar, Islamabad and Lahore, but only about twice as bad in Quetta.
Out of 78 city-months in the study, exactly one had a median within the WHO guideline: Quetta in May 2026, at 14.4 µg/m³.
Why these cities differ
The data shows when and where the air is worst; it does not measure why. Several well-known factors fit the pattern and are the next things to test:
- Faisalabad and Lahore are Punjab's dense industrial and population centres, with textile mills and heavy industry, very heavy traffic, crop-residue burning in the surrounding farmland, and the geography of the Indo-Gangetic plain, where winter inversions trap pollution close to the ground.
- Karachi may benefit from sea breezes that keep moving polluted air away.
- Quetta sits at high altitude, with lower industrial density than the plains.
Peshawar deserves more attention than it gets. Its winter peak (a monthly median of 230 µg/m³ in December) was almost level with Lahore's.
Who is measuring?
All six cities had data on 364 days, but the monitoring is very uneven. On a typical day Lahore had 46 sensors reporting, Karachi 14, Islamabad 18, Faisalabad 20, Peshawar 9 and Quetta only 7. Of the 223 sensors used, just one is a reference-grade monitor, in Islamabad; the rest are low-cost sensors.
That matters. With few sensors, a city's numbers can be swayed by a handful of local pockets, so the results for Quetta and Peshawar are less certain than for Lahore. Low-cost sensors can also read high in humid conditions, and humidity differs a lot between coastal Karachi and dry Quetta.
Limitations
A fixed 25 km circle is a simple definition of a city; Islamabad's circle also covers much of Rawalpindi. A yearly mean of daily values approximates, but is not, an official annual mean. The causes discussed above are hypotheses, not results.
Next steps
- Apply a humidity correction to the low-cost sensors and check whether the ranking holds.
- Add wind, temperature and satellite fire counts to test the explanations.
- Build a small AI agent that answers questions about these cities' air, in English and Roman Urdu, using this data as a tool.
Data: OpenAQ (openaq.org), daily PM2.5 aggregates; the licences of the individual data providers apply. Guideline values: WHO Global Air Quality Guidelines (2021).