
Experiment · Pakistan · Forecasting
I tried to predict next week's price shocks in 17 Pakistani cities. Past prices could not do it
Using the Pakistan Bureau of Statistics' weekly city prices, I tested whether a simple model could warn of next week's sharp price rises. It could not, and that result says something about how these shocks happen.
By Muzammal Hussain · 9 November 2026 · 5 min read
Every week the Pakistan Bureau of Statistics (PBS) publishes the prices of 51 essential items in 17 cities for its Sensitive Price Indicator. For a family that spends close to half its budget on food, a sudden jump in the price of tomatoes, onions or chicken matters. I wanted to know whether those jumps can be seen coming a week ahead from the price history alone.
Key findings
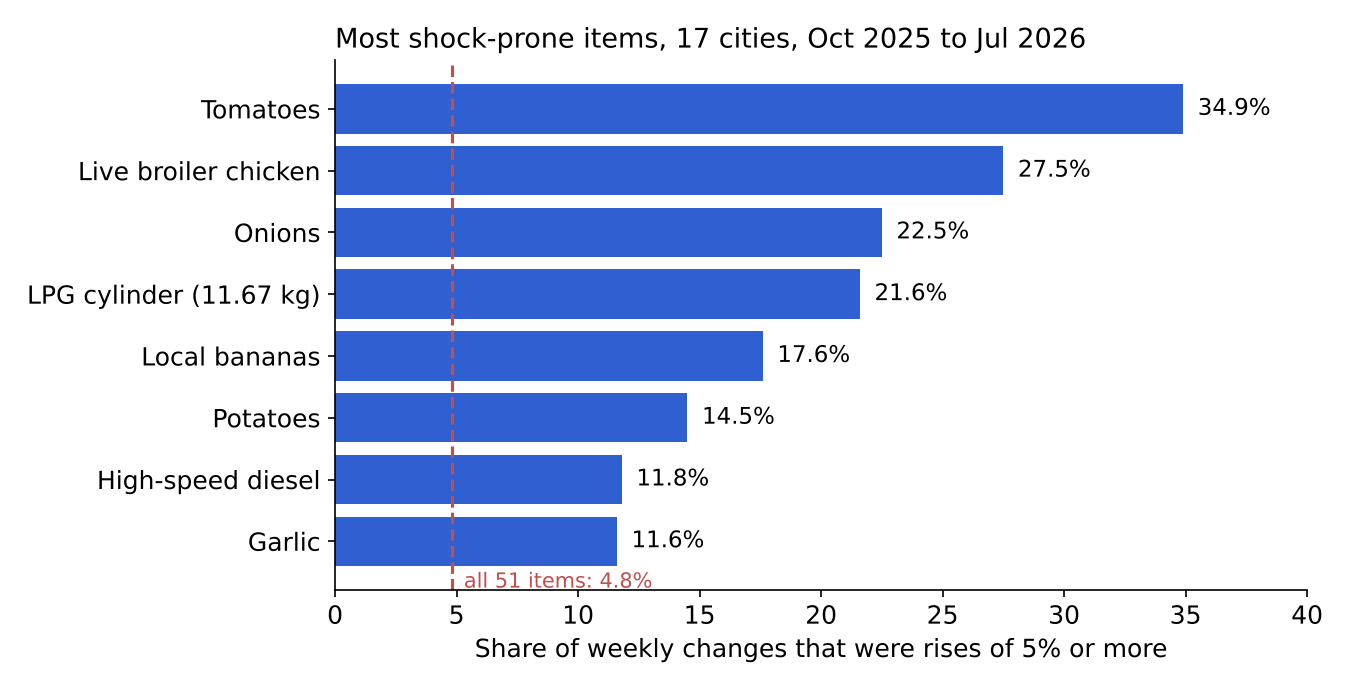
- Across 17 cities and 51 items, 4.8% of weekly price changes were rises of 5% or more. For tomatoes it was 34.9%, for live broiler chicken 27.5% and for onions 22.5%.
- A model trained on the previous four weeks of each price could not beat the simplest possible forecast, "next week's price equals this week's": its average error was 1.9% against 1.5%.
- Its early warnings were right about 2 times in 100, and it never raised a confident alert. Changing the shock threshold to 3% or 10% did not change the picture.
- On this data, past prices alone do not predict next week's shocks. Any useful warning will need other signals, such as supply, weather, fuel prices and the calendar.
The data
I used the weekly city-and-item prices that PBS publishes as Excel annexes to its Sensitive Price Indicator, in a version parsed and documented by OpenDoc Pakistan. It covers 35 weekly releases from 23 October 2025 to 2 July 2026. After keeping only reported average prices, it has 30,240 city-item-week prices.
One practical detail mattered: PBS sometimes publishes a day early or late around public holidays, so consecutive releases can be 6 or 8 days apart. My first version of the code expected exactly 7 days and threw most of the data away. Treating 6 to 8 days as one week, while still skipping genuinely missing releases, fixed it.
The test
For every city and item, the model saw the last four weekly price changes and tried to predict the next one. A "shock" was a rise of 5% or more in a week. I compared three forecasts:
- No change: next week's price is this week's.
- Typical change: the median weekly change of that item in that city during training.
- Pooled model: one ridge regression trained across all cities and items on the recent changes.
Each forecast came with a range calibrated on separate weeks. If the top of the range reached a 5% rise, the item was put on "watch"; if even the bottom reached it, on "alert". The data were split by time, never at random: the earliest weeks for training, the next for calibration, and the last six weeks (April to May 2026, 5,184 forecasts, 243 shocks) for the test.
Results
| Forecast | Average error | Watches that were real shocks | Shocks caught by a watch | Alerts |
|---|---|---|---|---|
| No change | 1.5% | 4.7% | 100% | 0 |
| Typical change | 1.6% | 4.0% | 82% | 0 |
| Pooled model | 1.9% | 2.5% | 45% | 0 |
The "no change" forecast catches every shock only because its range is wide enough to put almost everything on watch; a watch list that includes everything is useless. The pooled model was more selective but less accurate. None of the three was confident enough to raise a single alert. The ranges themselves were honest: they held the true change about 90% of the time, as designed.
What I take from it
- Weekly price shocks for tomatoes, onions and chicken behave like news, not like trends. Last month's prices do not tell you that next week's supply will drop.
- A useful early warning will need information from outside the price series: crop arrivals, weather, fuel and transport costs, imports, and the Ramadan and Eid calendar.
- Simple baselines are essential. Without the "no change" forecast, the model's 45% recall could have looked like a success.
Limitations
- Only 35 weeks of data and a single test period of six weeks. Longer PBS history is needed before drawing firm conclusions.
- One simple model using price history only. Richer models and outside data may do better.
- A market price shock is not a measure of household hunger, and these labels are research outputs, not official warnings.
- PBS does not state an open licence for redistributing its data, so the repository downloads it from its documented source instead of including it.
What comes next
The next step is to build several years of weekly PBS prices, add calendar, fuel and seasonal signals, and test over many rolling periods rather than one. That will show which items and cities are predictable at all, and which are not.
Data: Pakistan Bureau of Statistics, weekly Sensitive Price Indicator city and item annexes, via the OpenDoc Pakistan "Pakistan Inflation and SPI Prices" dataset (file revision 54c5231). Context: IPC Pakistan analysis, April 2026; FEWS NET Pakistan Food Security Outlook, June 2026. Conformal prediction intervals follow the split-conformal method.